Analysing the 2024 OV-Klantenbarometer: passengers' experience of public transport
How do passengers rate public transport in the Netherlands in 2024? Each year, CROW examines this through the OV-Klantenbarometer, the country's largest passenger satisfaction survey. More than 108,000 passengers assessed their public transport journey, covering over eight thousand services by bus, tram, metro, regional train and the main rail network. At first glance, the result is unsurprising: the average score remains 7.8 out of 10, the same as last year.
Yet this figure conceals a series of underlying shifts. Satisfaction varies by transport mode, demographic group and type of passenger. These differences reveal a great deal about how public transport is actually experienced, both operationally and socially. In this article, we explore the main patterns, signals and tensions. We treat the average as a starting point for better policy, more focused concessions and a broader understanding of what public transport means to passengers.
Differences between transport modes
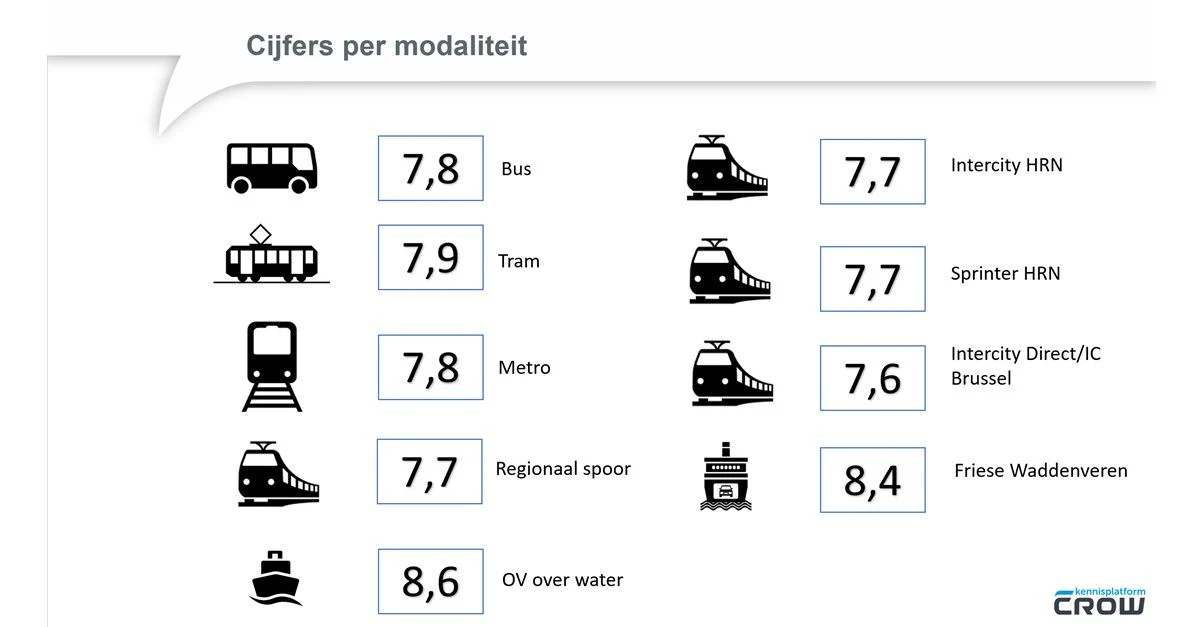
As in previous years, waterborne transport remains the highest-rated mode, with an average passenger score of 8.6. Regional buses and trams also perform well, at 7.9. The metro matches the overall average of 7.8. City buses, regional trains and Sprinter services follow closely at 7.7. Intercity Direct and IC Brussel remain at the bottom, at 7.6.
The differences are small but stable and consistent over the years. Notably, modes associated with comfort, such as waterborne public transport and trams, consistently receive higher ratings than intensive, large-scale networks where crowding, speed and efficiency predominate.
Young and old: the generation gap in public transport experiences
The figures confirm a long-standing pattern: older people consistently rate public transport more highly than younger people. Passengers aged 65 and over give an average score of 8.4. Those under 28 remain around 7.7. The difference is greatest during peak hours. Younger people more often experience crowding, difficulty finding a seat and less reliable information.
The proportion of respondents under 28 has also declined steadily over the past three years. The average age of public transport passengers is rising. Although it remains below the average age of the Dutch population, at 42.4 years, the trend is clear. This directly affects how the figures should be interpreted and the perspective from which public transport is assessed.
Purpose and frequency: how use affects ratings
People using public transport for leisure, cultural activities or family visits are consistently more positive than those travelling to work or education. Occasional passengers also rate their journeys more highly than daily users. Those travelling five times a year give an average score of 8.0. Passengers using public transport four or more days a week remain at 7.6.
The figures show that the satisfaction gap widens as use becomes more intensive. People who regularly depend on public transport find it less pleasant. This inequality in experience deserves serious attention, both from a customer-service perspective and in terms of social mobility and inclusion.
OVPay is growing, but the smartcard remains dominant
OVPay has now firmly established itself in public transport. Its use grew from 9 to 15 per cent in regional public transport and from 6 to 9 per cent on the main rail network. Nevertheless, the OV-chipkaart remains by far the most widely used option, at 83 and 84 per cent respectively. Passengers rate both OVPay and the smartcard at 8.5 for ease of use.
Notably, OVPay is still unavailable to season-ticket holders. Regular passengers, often commuters or students, would particularly benefit from greater flexibility. Until that connection is made, the system remains fragmented. This technical barrier stands in the way of wider adoption.
Price remains the weakest point
The price of public transport is once again its lowest-rated aspect, with an average score of 5.7. This score has remained unchanged for years, neither falling further nor improving. Passengers are positive about ease of payment but negative about the price itself. That distinction is crucial: the issue is the amount paid, rather than the method of payment.
Negative price ratings mainly come from younger people and frequent passengers, precisely the groups using public transport intensively. The fare structure therefore touches on the very purpose of public transport: accessible travel for everyone.
Regional differences in satisfaction
At concession level, there are clear standouts. Bus services in Friesland, Limburg, Gooi- en Vechtstreek and Zuid-Holland Noord score above average. Among regional trains, the Zwolle–Kampen line stands out with a score of 8.0.
On the main rail network, the northern region's Sprinter services score highest, at 7.9. Amsterdam and Rotterdam remain at the average. Intercity Direct and IC Brussel again rank lowest in 2024, with low scores for price, at 4.3, and information, at 6.2. This raises the question of whether passengers on international or premium services have different expectations that are not being met.
What passengers most want to improve
Passengers are clear about their priorities. The five most requested improvements are frequency, the chance of finding a seat, cleanliness, information during delays and punctuality. Their urgency varies by mode. Frequency is most often mentioned for buses and waterborne transport, while crowding and comfort dominate for metros and regional trains. Cleanliness is a concern across almost all modes, with satisfaction declining steadily over the past four years.
Information during disruption remains a persistent problem. Despite investment in digital journey information and real-time updates, this aspect continues to receive low average scores. Younger passengers place particular importance on it and judge it more critically than other groups.
Recurring disruption has a limited effect on ratings
2024 also brought operational challenges. Staff shortages, sickness absence and railway works caused disruption. Yet these factors appear to have little effect on journey ratings. Passengers seem to distinguish between occasional inconvenience and underlying service quality. This distinction is important because it shows that passengers remain loyal to the system despite difficult circumstances, provided the basics are sound.
Reflection and implications
The 2024 OV-Klantenbarometer reveals a public transport system with a good average score, but its weaknesses should not be ignored. Younger people, frequent users and commuters consistently rate public transport lower than older people and occasional passengers. Experiences are becoming more varied. This calls for more targeted policy focused on the specific experiences of different groups rather than on averages.
Improving quality requires differentiation: between modes, between groups and between journey purposes. The figures show that trust in public transport cannot be taken for granted. It must continue to be earned through reliability, comfort and affordability, with attention to passengers who depend on a well-functioning system every day rather than using it occasionally.
📄 The full report can be downloaded from CROW:OV-Klantenbarometer 2024 – main report and dashboard
All articles